Binary
Visualizations

Bubbles screen saver
Looking inside Files
Inspired by, and created from info in a talk given by Chris Domas at Derbycon 2012. These are visualization of binary data using various techniques and algorithms to make patterns visually apparent. This project taught me a lot of about digital signal processing and how the inside of different binary data packages are structured.
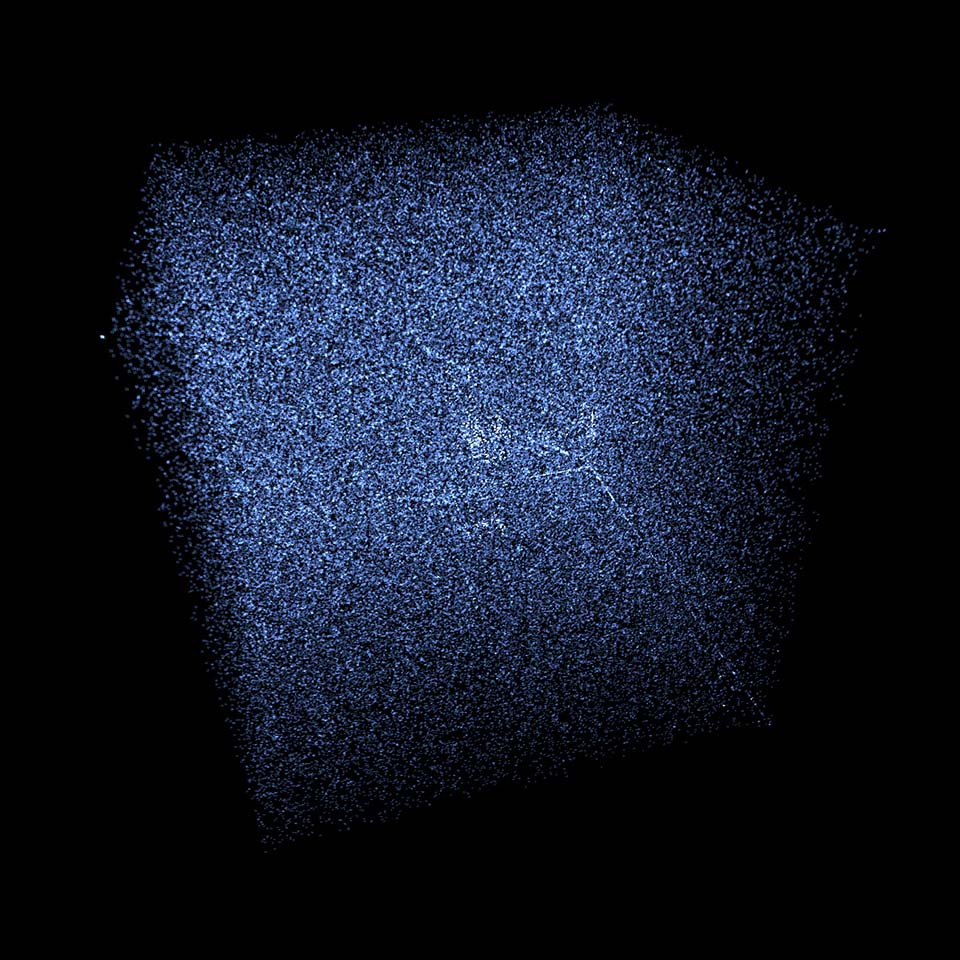
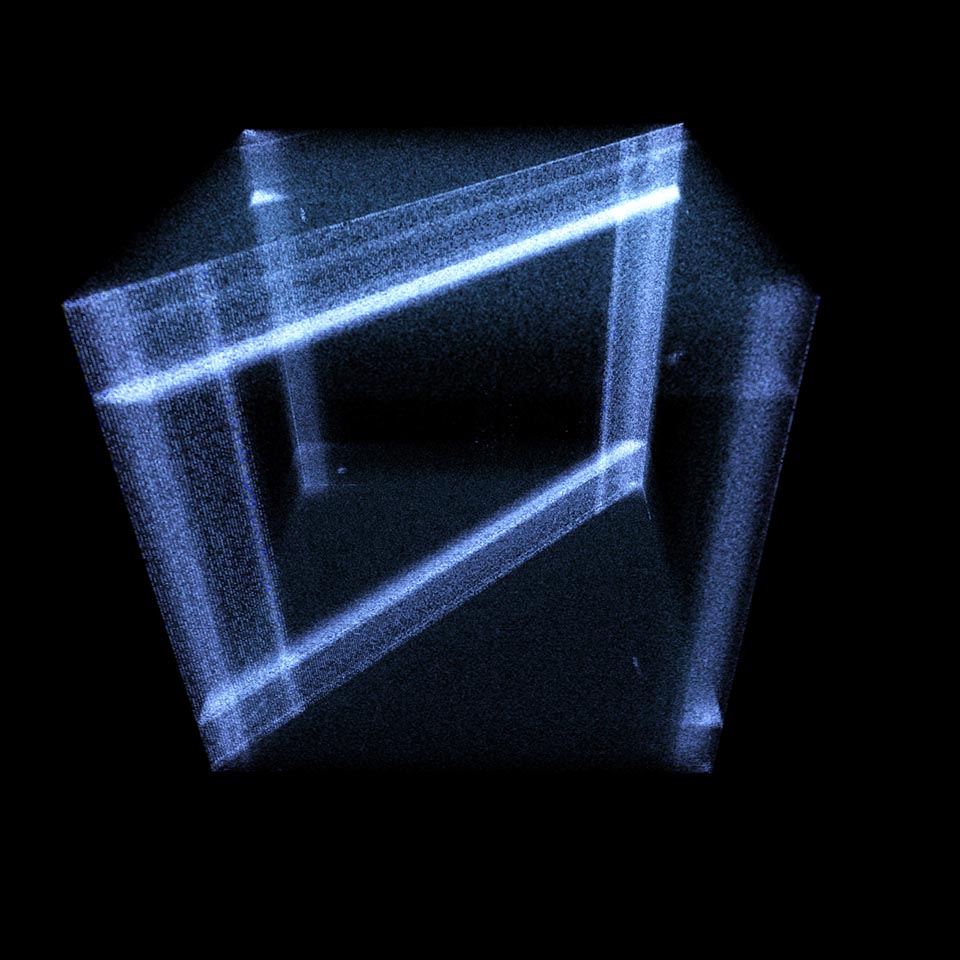
Trigraph
Below and to the right are trigraphs of binary byte values. This is an implementation of Chris's extension of Greg Conti's 'digraph' plot into 3D
The algorithm take every three consecutive bytes and treats them as XYZ coordinates. A histogram is then built up from these triplets within a 256³ volumetric cube. The advantage of arranging the data this way is it allows you to see patterns of consecutive values.
For instance, a smooth gradient will always have a similar byte procession and create a straight line in the 3D plot. English ASCII makes a well defined cube due to similar and frequent letter processions. Null terminated strings will show up as projections of this ASCII cube onto the walls of the volume.
Zip File
Compressed pdf

Wave File
Kornshell

Photoshop file

ASCII

Bubbles screen saver
Zip File

Byte Histogram
Here's a simple visualization of the individual bytes and a histogram of their frequency in the file. Notice how the zip file has a very even distribution. This is because the compression is designed to increase the entropy to as high as possible, removing (compressing) contiguous repeats of data.
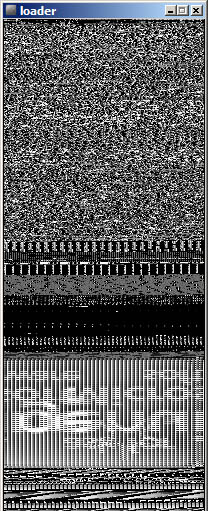
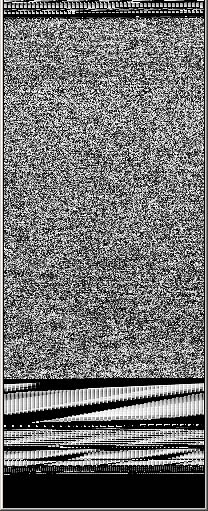
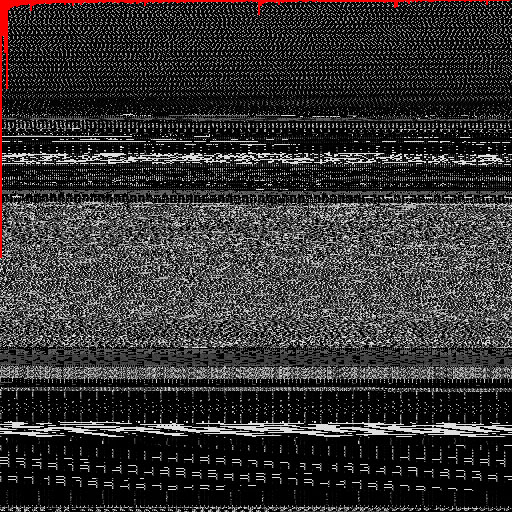
Byte arranging
This algorithm arrays the bytes in horizontal rows, wrapping around to the next line (like word-wrap but with bytes). This makes it possible to vary the row length looking for image convergences formed from embedded bmp data in the file.
Shown here is windows notepad.exe. You can clearly see that there is a giant logo of some sort (which says something like 'genuine Microsoft'). As far as I'm aware, this never appears in the program's UI anywhere.
Bubbles screen saver

Byte Grouping by value
Values are plotted on a Hilbert curve to maintain some amount of spacial relevance (Aldo Cortesi). This visualization makes it quick to spot likely areas of ASCII text in files. It also makes blocks of similarly patterned data very apparent.
Black = byte value '0'
Blue = 32-127 (ASCII)
White = byte value '255'
Red = any other byte value
Bubbles Screensaver

Entropy
Based on more work by Aldo Cortesi, this is a visualization of a file's binary entropy. Most useful for detecting compressed sections of code.
I used a moving window to compute local Shannon entropy. The results are plotted on the same Hilbert space filling curve to make the blocks of data more apparent. Here, pink is high entropy, and blue is low, with black being none.
Zip File

Ultra Compressed Zip file

Shown here is the same file compressed with two different settings using 7zip.
Notice the difference between the compressed and ultra-compressed zip files. You can clearly see the regions which were removed/optimized with the more aggressive compression. I suspect some of the uncompressed data at the beginning is likely some sort of header information.
There are several different ways to measure entropy, so something I'd like to try in the future are these various algorithms to see what if any more useful data they can provide.
Bubbles Screensaver

Self similarity
The X and Y axis represent bytes and their positions in the file, and the colors correspond to how close the associated bytes are in value, with white being a perfect match. The green line is the identity line.
What this shows is where the file had repeated byte blocks. This can be useful for finding repeated segments, however I've not found that to be terribly interesting or useful.
Kornshell (ksh)

Zip file
